
1. Surface waters
In 2017, there were 1,940 surface water sections (sites) under national monitoring program. 1,317 water sections (sites) met Grade I~III water quality standard, taking up 67.9%; 462 water sections (sites) met Grade IV and V water quality standard, taking up 23.8%; 161 failed to meet Grade V standard, taking up 8.3%. Compared with that of 2016, the ratio of sections meeting Grade I~III water quality standard went up by 0.1 percentage point, and those failing to meet Grade V standard went down by 0.3 percentage point.
2. River basins
In 2017, out of the 1,617 water sections under national monitoring program in 7 major river basins, namely the Yangtze River, Yellow River, Pearl River, Songhua River, Huaihe River, Haihe River and Liaohe River as well as rivers in Zhejiang and Fujian, rivers in northwestern and southwestern parts of China, 35 met Grade I standard, taking up 2.2%; 594 met Grade II standard, taking up 36.7%; 532 met Grade III standard, taking up 32.9%; 236 met Grade IV standard, taking up 14.6%; 84 met Grade V standard, taking up 5.2%; 136 were of the quality inferior to Grade V standard, taking up 8.4%. Compared with that of 2016, the percentage of water sections meeting Grade I was up by 0.1 percentage point; Grade II down by 5.1 percentage points; Grade III up by 5.6 percentage points; Grade IV up by 1.2 percentage points; Grade V down by 1.1 percentage points, and those inferior to Grade V down by 0.7 percentage point.
Rivers in northwest China and rivers in southwest China met excellent quality standard. Rivers in Zhejiang and Fujian, the Yangtze River and Pearl River met good quality standard. The Yellow River, Songhua River, Huaihe River and Liaohe River were of slight pollution, and Haihe River was under moderate pollution. The Yangtze River basin witnessed sound water quality. In all the 510 water sections under national monitoring program, 2.2% met Grade I standard, 44.3% met Grade II standard; 38.0% met Grad III standard; 10.2% met Grade IV standard; 3.1% met Grade V and 2.2% were inferior to Grade V standard. Compared with that of 2016, the percentage of water sections meeting Grade I was down by 0.5 percentage point; Grade II down by 9.2 percentage points; Grade III up by 11.9 percentage points; Grade IV up by 0.6 percentage point; Grade V down by 1.4 percentage points and those inferior to Grade V down by 1.3 percentage points. Water quality of the main stream of the Yangtze River was excellent. In 59 water sections under national monitoring program, 6.8% met Grade I standard; 40.7% met Grade II standard; and 52.5% met Grade III standard. There was no water section meeting Grade IV, Grade V or failing to meet Grade V standard. Compared with that of 2016, the percentage of water sections meeting Grade II standard was down by 10.1 percentage points, Grade III up by 15.2 percentage points, Grade IV down by 5.1 percentage points, and others kept unchanged. The major tributaries of the Yangtze River were of good water quality. In 451 water sections under national monitoring program, 1.6% met Grade I standard, down by 0.6 percentage point compared with that of 2016; 44.8% met Grade II standard, down by 9.1 percentage points; 36.1% met Grade III standard, up by 11.5 percentage points; 11.5% met Grade IV standard, up by 1.3 percentage points; 3.5% met Grade V standard, down by 1.6 percentage points; 2.4% failed to meet Grade V standard, down by 1.6 percentage points.

Water Quality of 7 Major River Basins, Rivers in Zhejiang and Fujian, Rivers in northwestern Part and Southwestern Part of China in 2017
The Yellow River basin was slightly polluted. The main pollution indicators were chemical oxygen demand (COD), ammonia nitrogen and total phosphorus (TP). Among the 137 water sections under national monitoring program, 1.5% met Grade I water quality standard, down by 0.7 percentage point compared with that of 2016; 29.2% met Grade II standard, down by 2.9 percentage points; 27.0% met Grade III standard, up by 2.2 percentage points; 16.1% met Grade IV standard, down by 4.3 percentage points; 10.2% met Grade V standard, up by 3.6 percentage points; and 16.1% failed to meet Grade V standard, up by 2.2 percentage points. The mainstream of the Yellow River was of excellent water quality. Among 31 water sections under national monitoring program, 6.5% met Grade I standard, same as that of 2016; 58.1% met Grade II standard, down by 6.4 percentage points; 32.3% met Grade III standard, up by 9.7 percentage points; 3.2% met Grade IV standard, down by 3.3 percentage points; and there was no water sections meeting Grade V or failing to meet Grade V standard, same as that of 2016. The major tributaries of the Yellow River were of intermediate pollution. Among 106 water sections under national monitoring program, there was no water sections meeting Grade I standard, down by 0.9 percentage point compared with that of 2016; 20.8% met Grade II standard, down by 1.8 percentage points; 25.5% met Grade III standard, same as that of 2016; 19.8% met Grade IV standard, down by 4.7 percentage points; 13.2% met Grade V standard, up by 4.7 percentage points; and 20.8% failed to meet Grade V standard, up by 2.9 percentage points.
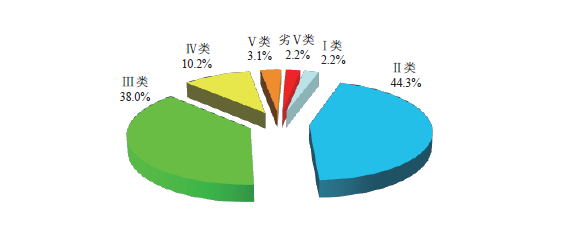
Proportion of Water Quality Grade of the Yangtze River Basin in 2017
The Pearl River basin was of good water quality. Among 165 water sections under national monitoring program, 3.0% met Grade I standard, up by 0.6 percentage point compared with that of 2016; 56.4% met Grade II standard, down by 6.0 percentage points; 27.9% met Grade III standard, up by 3.1 percentage points; 6.1% met Grade IV standard, up by 1.3 percentage points; 2.4% met Grade V standard, up by 0.6 percentage point; and 4.2% failed to meet Grade V standard, up by 0.6 percentage point. The mainstream of the Pearl River was of good water quality. Among 50 water sections under national monitoring program, the proportions of water sections meeting Grade I, II, III, IV and V was 2.0%, 60.0%, 24.0%, 10.0% and 2.0% respectively, and 2.0% failed to meet Grade V standard. Compared with that of 2016, the percentage of water sections meeting Grade I was down by 2.0 percentage points, Grade II down by 12.0 percentage points, Grade III up by 12.0 percentage points and those inferior to Grade V up by 2.0 percentage points, and others kept unchanged. The major tributaries of the Pearl River were of good water quality. Among 101 water sections under national monitoring program, 4.0% met Grade I standard, up by 2.0 percentage points compared with that of 2016; 50.5% met Grade II standard, down by 5.9 percentage points; 31.7% met Grade III standard, up by 1.0 percentage point; 5.0% met Grade IV standard, up by 2.0 percentage points; 3.0% met Grade V standard, up by 1.0 percentage point; and 5.9% failed to meet Grade V standard, same as that of 2016.
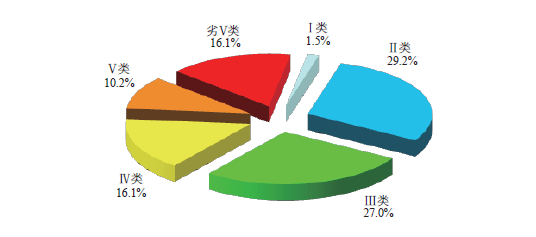
Proportion of Water Quality Grade of the Yellow River Basin in 2017
I类:Grade I
II类:Grade II
III类:Grade III
IV类:Grade IV
V类:Grade V
劣V类:Inferior to Grade Ⅴ
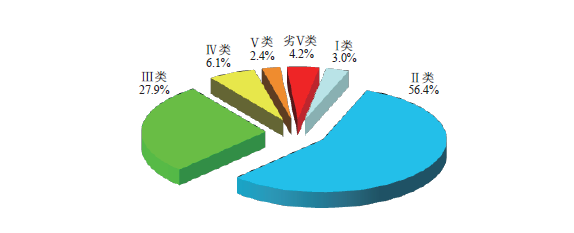
Proportion of Water Quality Grade of the Pearl River Basin in 2017
I类:Grade I
II类:Grade II
III类:Grade III
IV类:Grade IV
V类:Grade V
劣V类:Inferior to Grade Ⅴ
Rivers in Hainan Island were of excellent water quality. Among 14 water sections under national monitoring program, no water section met Grade I standard, and 85.7% met Grade II standard, up by 14.3 percentage points compared with that of 2016; 14.3% met Grade III standard, down by 14.3 percentage points; and no water sections fell within the categories of Grade I, IV, V or inferior to Grade V standard, keeping unchanged as that of 2016.
The Songhua River basin was slightly polluted. The main pollution indicators were COD, permanganate index and ammonia nitrogen. Among all 108 water sections under national monitoring program, no section met Grade I standard, same as that of 2016; 14.8% met Grade II standard, up by 0.9 percentage point; 53.7% met Grade III standard, up by 7.4 percentage points; 25.0% met Grade IV standard, down by 4.6 percentage points; 0.9% met Grade V standard, down by 2.8 percentage points; and 5.6% failed to meet Grade V standard, down by 0.9 percentage point. The mainstream of Songhua River was of good water quality. Among 17 water sections under national monitoring program, no section met Grade I standard, Grade V or failed to meet Grade V standard, same as that of 2016; 11.8% met Grade II standard, down by 11.7 percentage points; 76.5% met Grade III standard, up by 5.9 percentage points; 11.8% met Grade IV standard, up by 5.9 percentage points. The waters of major tributaries of the Songhua River were of sight pollution. Among 56 water section under the national monitoring program, no sections met Grade I standard, same as that of 2016; 19.6% met Grade II standard, up by 5.3 percentage points; 48.2% met Grade III standard, up by 8.9 percentage points; 21.4% met Grade IV standard, down by 10.7 percentage points; 1.8% met Grade V standard, down by 3.6 percentage points; and 8.9% failed to meet Grade V standard, same as that of 2016.
The waters of Heilongjiang River were under slight pollution. Among 18 water sections under national monitoring program, no section met Grade I standard, same as that of 2016; 16.7% met Grade II standard, up by 11.1 percentage points compared with that of 2016; 44.4% met Grade III standard, up by 5.5 percentage points; 33.3% met Grade IV standard, down by 16.7 percentage points; no section met Grade V standard, down by 5.6 percentage points and 5.6% failed to meet Grade V standard, up by 5.6 percentage points.
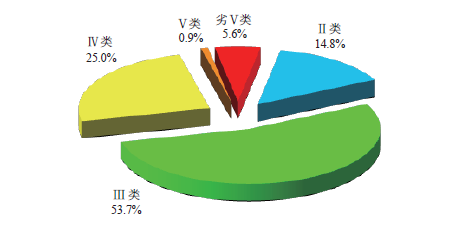
Proportion of Water Quality Grade of the Songhua River Basin in 2017
II类:Grade II
III类:Grade III
IV类:Grade IV
V类:Grade V
劣V类:Inferior to Grade Ⅴ
The waters of Tumen River were of slight pollution. Among 7 water sections under national monitoring program, no section met Grade I, II, V or failed to meet Grade V standard; 57.1% met Grade III standard, same as that of 2016; 42.9% met Grade IV standard, up by 28.6 percentage points compared with that of 2016. Percentages of water sections meeting Grade V standard and inferior to Grade V standard fell by 14.3 percentage points respectively compared with that of 2016. Others kept unchanged as that of 2016.
The waters of Wusuli River were of slight pollution. Among 9 water sections under national monitoring program, no section met Grade I, II, V or was inferior to Grade V standard; 55.6% met Grade III standard, up by 11.1 percentage points; 44.4% met Grade IV standard, down by 11.1 percentage points compared with that of 2016. Others kept unchanged as that of 2016.
The waters of the Suifen River were of good water quality. 1 water section under national monitoring program met Grade III standard, witnessing no significant change compared with that of 2016.
The Huaihe River basin was slightly polluted. The main pollution indicators were COD, TP and fluoride. Among 180 water sections under national monitoring program, no section met Grade I standard, same as that of 2016; 6.7% met Grade II standard, down by 0.5 percentage point compared with that of 2016; 39.4% met Grade III standard, down by 6.7 percentage points; 36.7% met Grade IV standard, up by 12.8 percentage points; 8.9% met Grade V standard, down by 6.7 percentage points; and 8.3% failed to meet Grade V standard, up by 1.1 percentage points. The mainstream of Huaihe River was of slight pollution. Among 10 water sections under national monitoring program, no section met Grade I, II or V standard, same as that of 2016; 70.0% met Grade III standard, down by 20.0 percentage points compared with that of 2016; 20.0% met Grade IV standard, up by 10.0 percentage points; 10.0% failed to meet Grade V standard, up by 10.0 percentage points. The waters of major tributaries of Huaihe River were of slight pollution. Among 101 water sections under national monitoring program, no section met Grade I standard, same as that of 2016; 9.9% met Grade II standard, same as that of 2016; 33.7% met Grade III standard, down by 1.9 percentage points; 39.6% met Grade IV standard, up by 10.9 percentage points; 9.9% met Grade V standard, down by 8.9 percentage points; 6.9% failed to meet Grade V standard, same as that of 2016.
The Yihe-Shuhe-Sishui water system saw slight pollution. Among 48 water sections under national monitoring program, no section met Grade I standard, same as that of 2016; 2.1% met Grade II standard, up by 2.1 percentage points compared with that of 2016; 56.2% met grade III standard, down by 16.7 percentage points; 31.2% met Grade IV standard, up by 12.4 percentage points; 6.2% met Grade V standard, up by 4.1 percentage points; and 4.2% failed to meet Grade V standard, down by 2.1 percentage points.
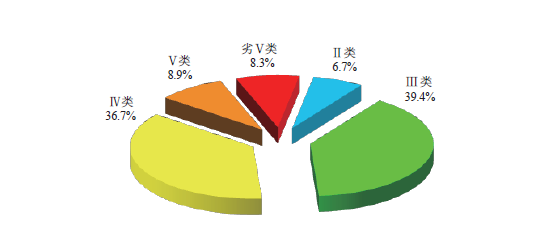
Proportion of Water Quality Grade of the Huaihe River Basin in 2017
I类:Grade I
II类:Grade II
III类:Grade III
IV类:Grade IV
V类:Grade V
劣V类:Inferior to Grade Ⅴ
The waters of rivers with sole estuary in Shandong Peninsula were of intermediate pollution. Among 21 water sections under national monitoring program, no section met Grade I standard, same as that of 2016; 4.8% met Grade II standard, down by 9.5 percentage points compared with that of 2016; 14.3% met Grade III standard, same as that of 2016; 42.9% met Grade IV standard, up by 23.9 percentage points; 14.3% met Grade V standard, down by 23.8 percentage points; and 23.8% failed to meet Grade V standard, up by 9.5 percentage points.
The Haihe River basin was moderately polluted. The major pollution indicators were COD, BOD5 and TP. Among 161 water sections under national monitoring program, 1.9% met Grade I standard, same as that of 2016; 20.5% met Grade II standard, up by 1.2 percentage points compared with that of 2016; 19.3% met Grade III standard, up by 3.2 percentage points; 13.0% met Grade IV standard, same as that of 2016; 12.4% met Grade V standard, up by 3.7 percentage points; and 32.9% failed to meet Grade V standard, down by 8.1 percentage points. There are 2 water sections of the mainstream of Haihe River under national monitoring program. Sanchakou water section met Grade III standard which saw improved water quality compared with 2016; and the other section at the sluice of the River failed to meet Grade V standard, basically the same as that of 2016. The waters of major tributaries of the Haihe River were of intermediate pollution. Among 125 water sections under national monitoring program, 2.4% met Grade I standard, same as that of 2016; 22.4% met Grade II standard, up by 4.0 percentage points compared with that of 2016; 15.2% met Grade III standard, up by 3.2 percentage points; 8.8% met Grade IV standard, down by 1.6 percentage points; 12.0% met Grade V standard, up by 4.8 percentage points, and 39.2% failed to meet Grade V standard, down by 10.4 percentage points.
The waters of Luanhe River were of slight pollution. Among 17 water sections under national monitoring program, no section met Grade I or was inferior to Grade V standard, same as that of 2016; 23.5% met Grade II standard, down by 17.7 percentage points compared with that of 2016; 41.2% met Grade III standard, down by 5.9 percentage points; 29.4% met Grade IV standard, up by 17.6 percentage points; 5.9% met Grade V standard, up by 5.9 percentage points compared with that of 2016. Others remained the same as that of 2016.
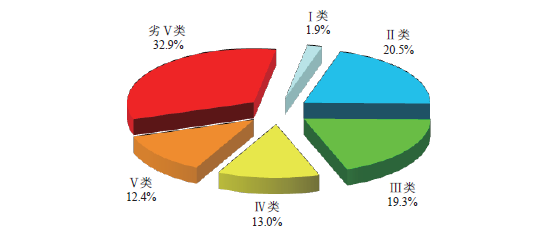
Proportion of Water Quality Grade of the Haihe River Basin in 2017
I类:Grade I
II类:Grade II
III类:Grade III
IV类:Grade IV
V类:Grade V
劣V类:Inferior to Grade Ⅴ
The waters of rivers in east Hebei and coastal areas were of slight pollution. Among 6 water sections under national monitoring program, no sections met Grade I, II and V standard; 33.3% met Grade III, 50.0% met Grade IV, and 16.7% failed to meet Grade V standard. Compared with that of 2016, the percentage of waters meeting Grade III was up by 16.6 percentage points, Grade IV down by 16.7 percentage points, and the sections of Grade I, II, V and that inferior to Grade V standard remained the same as that of 2016.
The Liaohe River basin was of slight pollution. The major pollution indicators were TP, COD, and BOD5. Among 106 water sections under national monitoring program, 2.8% met Grade I standard, up by 0.9 percentage point compared with that of 2016; 23.6% met Grade II standard, down by 7.5 percentage points; 22.6% met Grade III standard, up by 10.3 percentage points; 24.5% met Grade IV standard, up by 1.9 percentage points; 7.5% met Grade V standard, down by 9.5 percentage points; and 18.9% failed to meet Grade V standard, up by 3.8 percentage points. The waters of the mainstream of the Liaohe River were of slight pollution. Among 15 water sections under national monitoring program, no section met Grade I or Grade II standard, the same as that of 2016; 13.3% met Grade III standard, the same as that of 2016; 46.7% met Grade IV standard, the same as that of 2016; 26.7% met Grade V standard, down by 6.6 percentage points compared with that of 2016; and 13.3% failed to meet Grade V standard, up by 6.6 percentage points. The waters of major tributaries of the Liaohe River were of heavy pollution. Among 21 water sections under national monitoring program, no section met Grade I standard, same as that of 2016; no section met Grade II standard, down by 9.5 percentage points compared with that of 2016; 14.3% met Grade III standard, down by 9.5 percentage points; 33.3% met Grade IV standard, up by 19.0 percentage points; 4.8% met Grade V standard, down by 19.0 percentage points; and 47.6% failed to meet Grade V standard, up by 19.0 percentage points.
The waters of the Daliaohe River System were of moderate pollution. Among 28 water sections under national monitoring program, no section met Grade I standard, same as that of 2016; 35.7% met Grade II standard, same as that of 2016; 25.0% met Grade III standard, up by 25.0 percentage points compared with that of 2016; 7.1% met Grade IV standard, down by 21.5 percentage points; 7.1% met Grade V standard, down by 10.8 percentage points; 25.0% failed to meet Grade V standard, up by 7.1 percentage points.
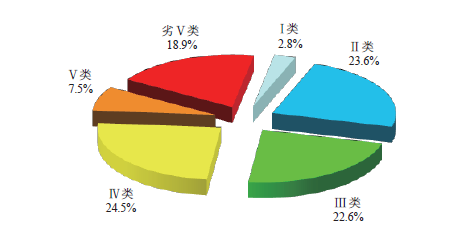
Proportion of Water Quality Grade of the Liaohe River Basin in 2017
I类:Grade I
II类:Grade II
III类:Grade III
IV类:Grade IV
V类:Grade V
劣V类:Inferior to Grade Ⅴ
The waters of the Yalujiang River System were of excellent quality. Among 13 water sections under national monitoring program, 15.4% met Grade I standard; 69.2% met Grade II standard; 15.4% met Grade III standard; no section met Grade IV, V or was inferior to Grade V standard. Compared with that of 2016, the percentage of waters meeting Grade I were up by 7.7 percentage points, Grade II down by 15.4 percentage points, and Grade III up by 7.7 percentage points while other grades stood the same as that of 2016.
Rivers in Zhejiang Province and Fujian Province were of good water quality. Among 125 water sections under national monitoring program, 2.4% met Grade I standard, down by 0.8 percentage point compared with that of 2016; 40.8% met Grade II standard, down by 12.8 percentage points; 45.6% met Grade III standard, up by 8.0 percentage points; 7.2% met Grade IV standard, up by 4.0 percentage points; 3.2% met Grade V standard, up by 0.8 percentage point; and 0.8% failed to meet Grade V standard, up by 0.8 percentage points.
Rivers in northwestern part of China were of good water quality. Among 62 water sections under national monitoring program, 12.9% met Grade I standard, up by 8.1 percentage points compared with that of 2016; 77.4% met Grade II standard, up by 1.6 percentage points; 6.4% met Grade III standard, down by 6.5 percentage points; 1.6% met Grade IV standard, down by 3.2 percentage points; 1.6% met Grade V standard, the same as that of 2016; and no sections failed to meet Grade V standard, the same as that of 2016.
Rivers in southwestern part of China were of excellent water quality. In 63 water sections under national monitoring program, no section met Grade I standard, down by 1.6 percentage points compared with that of 2016; 79.4% met Grade II standard, the same as that of 2016; 15.9% met Grade III standard, up by 6.4 percentage points; 3.2% met Grade IV standard, down by 4.7 percentage points; no section met Grade V standard, the same as that of 2016; 1.6% failed to meet Grade V standard, the same as that of 2016.
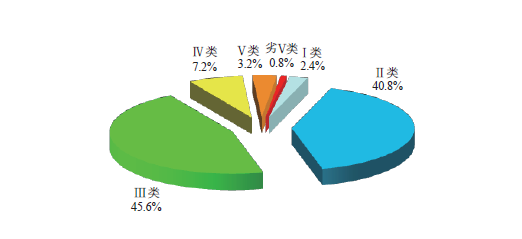
Proportion of Water Quality Grade of the Rivers in Zhejiang Province and Fujian Province in 2017
I类:Grade I
II类:Grade II
III类:Grade III
IV类:Grade IV
V类:Grade V
劣V类:Inferior to Grade Ⅴ
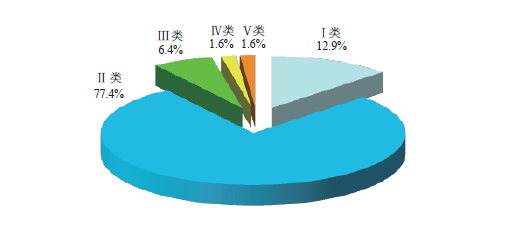
Proportion of Water Quality Grade of the Rivers in Northwestern Part of China in 2017
I类:Grade I
II类:Grade II
III类:Grade III
IV类:Grade IV
V类:Grade V
劣V类:Inferior to Grade Ⅴ

Proportion of Water Quality Grade of the Rivers in Southwestern Part of China in 2017
I类:Grade I
II类:Grade II
III类:Grade III
IV类:Grade IV
V类:Grade V
劣V类:Inferior to Grade Ⅴ
3. Lakes (reservoirs)
In 2017, among 112 major lakes (reservoirs) across the country, 6 lakes (reservoirs) met Grade I standard, taking up 5.4%; 27 met Grade II standard, taking up 24.1%; 37 met Grade III standard, taking up 33.0%; 22 met Grade IV standard, taking up 19.6%; 8 met Grade V standard, taking up 7.1%; and 12 failed to meet Grade V standard, taking up 10.7%. The main pollution indicators were TP, COD and permanganate index. Among 109 lakes (reservoirs) under the monitoring of nutritional status, 9 were under oligotrophic status; 67 were under mesotrophic status; 29 were under slight eutrophication, and 4 were under intermediate eutrophication.
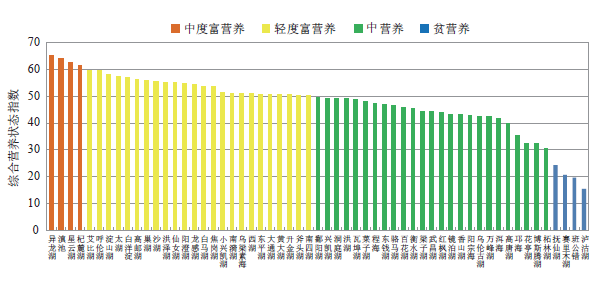
Trophic Level Index of Major Reservoirs in 2017
中度富营养:Moderate eutrophication
轻度富营养:Slight eutrophication
中营养:Mesotrophic status
贫营养:Oligotrophic status
综合营养状态指数:Comprehensive nutrition state index
底部(从左至右):
Yilong Lake; Dianchi Lake; Xingyun Lake; Qilu Lake; Aibi Lake; Hulun Lake; Dianshan Lake; Taihu Lake; Baiyangdian Lake; Gaoyou Lake; Chaohu Lake; Shahu Lake; Hongze Lake; Xiannv Lake; Yangcheng Lake; Longgan Lake; Baima Lake; Jiaogang Lake; Xiaoxingkai Lake; Nanyi Lake; Wuliangsuhai Lake; West Lake; Dongping Lake; Datong Lake; Huangda Lake; Shengjin Lake; Futou Lake; Nansi Lake; Poyang Lake; Xingkai Lake; Dongting Lake; Honghu Lake; Wabu Lake; Caizi Lake; Chenghai Lake; Dongqian Lake; Luoma Lake; Baihua Lake; Hengshui Lake; Liangzi Lake; Wuchang Lake; Hongfeng Lake; Jingpo Lake; Xiangshan lake; Yangzonghai Lake; Wulungu Lake; Wanfeng Lake; Erhai Lake; Gaotang Lake; Qionghai Lake; Huating Lake; Bosten Lake; Zhelin Lake; Fuxian Lake; Sailimu Lake; Banggongcuo Lake; Lugu Lake
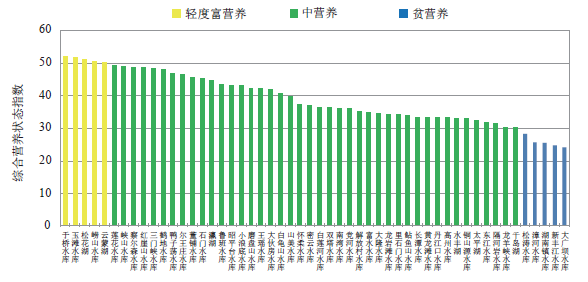
Trophic Level Index of Major Reservoirs in 2017
轻度富营养:Slight eutrophication
中营养:Mesotrophic status
贫营养:Oligotrophic status
综合营养状态指数:Comprehensive nutrition state index
底部(从左至右):
Yuqiao Reservoir; Yutan Reservoir; Songhua Lake; Laoshan Reservoir; Yunmeng Lake; Lianhua Reservoir; Xiashan Reservoir; Cha'ersen Reservoir; Hongyashan Reservoir; Sanmenxia Reservoir; Hedi Reservoir; Yazidang Reservoir; Erwangzhuang Reservoir; Dongpu Reservoir; Shimen Reservoir; Yinghu Lake; Luban Reservoir; Zhaopingtai Reservoir; Xiaolangdi Reservoir; Mopanshan Reservoir; Wangyao Reservoir; Dahuofang Reservoir; Baiguishan Reservoir; Shanmei Reservoir; Huairou Reservoir; Miyun Reservoir; Bailianhe Reservoir; Shuangta Reservoir; Nanwan Reservoir; Danghe Reservoir; Jiefangcun Reservoir; Fushui Reservoir; Dalong Reservoir; Longyantan Reservoir; Lishimen Reservoir; Nianyushan Reservoir; Changtan Reservoir; Huanglongtan Reservoir; Danjiangkou Reservoir; Gaozhou Reservoir; Shuifeng Reservoir; Tongshanyuan Reservoir; Taiping Lake; Dongjiang Reservoir; Geheyan Reservoir; Longyangxia Reservoir; Qiandao Lake; Songtao Reservoir; Zhanghe Reservoir; Hunanzhen Reservoir; Xinfengjiang Reservoir; Daguangba Reservoir
Water Quality of Major Lakes (Reservoirs) in 2017
| Water quality grade | The three lakes | Major lakes | Major reservoirs |
| Grade I and II standard | -- | Hongfeng Lake, Gaotang Lake, Qionghai Lake, Huating Lake, Fuxian Lake, Sailimu Lake, Bangongcuo Lake, Lugu Lake | Dongpu Reservoir, Dahuofang Reservoir, Shanmei Reservoir, Huairou Reservoir, Bailianhe Reservoir, Shuangta Reservoir, Danghe Reservoir, Jiefangcun Reservoir, Dalong Reservoir, Longyantan Reservoir, Lishimen Reservoir, Nianyushan Reservoir, Changtan Reservoir, Danjiangkou Reservoir, Gaozhou Reservoir, Tongshanyuan Reservoir, Taiping Lake, Geheyan Reservoir, Longyangxia Reservoir, Qiandao Lake, Songtao Reservoir, Zhanghe Reservoir, Hunanzhen Reservoir, Xinfengjiang Reservoir, Daguangba Reservoir |
| Grade III standard | -- | Jiaogang Lake, Nanyi Lake, West Lake, Shengjin Lake, Wabu Lake, Caizi Lake, Dongqian Lake, Luoma Lake, Baihua Lake, Hengshui Lake, Liangzi Lake, Wuchang Lake, Xiangshan Lake, Yangzong Lake, Wanfeng Lake, Erhai Lake, Zhelin Lake | Laoshan Reservoir, Yunmeng Lake, Hongyashan Reservoir, Sanmenxia Reservoir, Hedi Reservoir, Yazidang Reservoir, Erwangzhuang Reservoir, Shimen Reservoir, Yinghu Lake, Zhaopingtai Reservoir, Xiaolangdi Reservoir, Mopanshan Reservoir, Wangyao Reservoir, Baiguishan Reservoir, Miyun Reservoir, Nanwan Reservoir, Fushui Reservoir, Huanglongtan Reservoir, Shuifeng Reservoir, Dongjiang Reservoir
|
| Grade IV standard | Taihu Lake | Gaoyou Lake, Yangcheng Lake, Longgan Lake, Baima Lake, Xiaoxingkai Lake, Dongping Lake, Huangda Lake, Futou Lake, Nansi Lake, Poyang Lake, Xingkai Lake ,Dongting Lake, Hong Lake, Jingpo Lake, Bosten Lake | Yuqiao Reservoir, Yutan Reservoir, Songhua Lake, Xiashan Reservoir, Chaersen Reservoir, Luban Reservoir |
| Grade V standard | Chaohu Lake | Qilu Lake, Dianshan Lake, Baiyangdian Lake, Shahu Lake, Hongze Lake and Xiannv Lake | Lianhua Reservoir |
| Inferior to Grade V standard* | Dianchi Lake | Yilong Lake, Xingyun Lake, Hulun Lake, Ulansuhai Nur, Tatong Lake | -- |
The Taihu Lake was of slight pollution. The main pollution indicator was TP. Among the 17 sites under national monitoring program, 2 met Grade III standard, taking up 11.8%, down by 11.7 percentage points compared with that of 2016; 9 met Grade IV standard, taking up 52.9%, down by 17.7 percentage points; 6 met Grade V standard, taking up 35.3%, up by 29.4 percentage points. No site met Grade I, II or failed to meet Grade V standard. Others remained the same as that of 2016.The Taihu Lake was under slight eutrophication. The rivers surrounding the Taihu Lake were of slight pollution. The main pollution indicators were ammonia nitrogen, COD and TP. Among 55 water sections under national monitoring program, 9 met Grade II standard, taking up 16.4%, down by 5.4 percentage points compared with that of 2016; 30 met Grade III standard, taking up 54.5%, up by 7.2 percentage points; 12 met Grade IV standard, taking up 21.8%, down by 3.7 percentage points; and 4 met Grade V standard, taking up 7.3%, up by 1.8 percentage points. No section met Grade I or failed to meet Grade V standard. Others remained the same as that of 2016.
The Chaohu Lake was of moderate pollution. The main pollution indicator was TP. Among the 8 water sites under national monitoring program, 3 met Grade IV standard, taking up 37.5%, down by 25.0 percentage points compared with that of 2016; 5 met Grade V standard, taking up 62.5%, up by 25.0 percentage points. No site met Grade I, Grade II, Grade III or failed to meet Grade V standard. Others remained the same as that of 2016. The Chaohu Lake was under slight eutrophication on average. The rivers surrounding the lake were under intermediate pollution. The main pollution indicators were ammonia nitrogen, TP and BOD5. Among 14 water sections under national monitoring program, 1 met Grade II standard, taking up 7.1%. 9 met Grade III standard, taking up 64.3%. 1 met Grade IV standard, taking up 7.1%, up by 7.1 percentage points compared with that of 2016; 3 failed to meet Grade V standard, taking up 21.4%, down by 7.2 percentage points compared with that of 2016. No sections met Grade I or Grade V standard. Others remained the same as that of 2016.
The Dianchi Lake on average was of heavy pollution. The main pollution indicators were COD, TP and BOD5. Among 10 sites under national monitoring program, 4 met Grade V standard, taking up 40.0%, down by 60 percentage points compared with that of 2016; 6 failed to meet Grade V, taking up 60.0%, up by 60 percentage points. No site met Grade I, II, III or IV standard, while others remained the same as that of 2016. The lake was under intermediate eutrophication on average. The rivers surrounding the Dianchi Lake were of slight pollution. The main pollution indicators were TP, COD and ammonia nitrogen. Among 12 water sections under national monitoring program, 1 met Grade II standard, taking up 8.3%; 3 met Grade III standard, taking up 25.0%; 6 met Grade IV standard, taking up 50.0%; 1 met Grade V, taking up 8.3%; 1 failed to meet Grade V standard, taking up 8.3%. No sections met Grade I standard. Compared with that of 2016, the percentage of sections meeting Grade III was up by 8.3 percentage points, Grade IV down by 8.3 percentage points, Grade V up by 8.3 percentage points, that inferior to Grade V down by 8.4 percentage points, and that of Grade I and II remained the same as that of 2016.
4. Groundwater
In 2017, departments of the previous Ministry of Land and Resources carried out water quality monitoring of groundwater at 5,100 monitoring sites (1,000 of which were at national level) from 223 administrative regions at prefecture level in 31 provinces, autonomous regions or municipalities. The groundwater aquifer system was monitored as a unit, and the monitoring was carried out on shallow groundwater, mainly phreatic water, and on middle deep groundwater, mainly confined water. The assessment results show that 8.8%, 23.1%, 1.5%, 51.8% and 14.8% percent of them had excellent, good, relatively good, poor and very poor water quality respectively. The main pollution indicators that went beyond the standard limits included total hardness, manganese, iron, total dissolved solids, “three kinds of nitrogen” (nitrite nitrogen, nitrate nitrogen and ammonia nitrogen), sulfate, fluoride, chloride. Some monitoring sites saw indicators of heavy metals, including arsenic, hexavalent chromium, lead and mercury, exceeding the standard limits.
In 2017, the water conservancy authorities monitored the groundwater quality of key regions in Songliao Plain, the Huanghai-Huaihai Plain, Shanxi Province, the basin and plain areas of northwest China and Jianghan Plain. The monitoring was mainly carried out on shallow groundwater, which has basically covered areas with intensive development and utilization of groundwater, and serious pollution. The assessment results of 2,145 monitoring sites show that the percent of monitoring sites with excellent, good, poor and very poor water quality was 0.9%, 23.5%, 60.9% and 14.6% respectively; there was no site with relatively good water quality. The main pollution indicators that went beyond the standard value, possibly due to relatively high background value of hydro-geological chemistry, included total hardness, total dissolved solids, manganese, iron and fluoride. In addition, the “three kinds of nitrogen” pollution was relatively heavy, and there was a certain degree of heavy metal and toxic organic pollution in some areas.
The Assessment Results of the Groundwater Quality of Different River Basins in 2017
| River basin | The percentage of monitoring sites (%) | ||
| Excellent, good and relatively good | Poor | Very poor | |
| Songhua River | 11.2 | 81.4 | 7.4 |
| Liaohe River | 8.8 | 81.0 | 10.2 |
| Haihe River | 31.4 |
52.8
| 15.7 |
| Yellow River |
26.8
| 45.7 | 27.5 |
| Huaihe River |
24.4
| 67.3 | 8.2 |
| Yangtze River | 14.3 | 80.0 | 5.7 |
| Inland rivers |
39.1
| 47.8 | 13.0 |
| Nationwide | 24.4 | 60.9 | 14.6 |
5. Centralized drinking water source areas of APL cities
In 2017, among 898 monitoring sections (sites) of the centralized drinking water source in 338 APL cities across the country, 813 met water quality standard for the whole year, taking up 90.5% of the total. Among them, 569 were surface drinking water source monitoring section (sites), 533 of which met water quality standard for the whole year, taking up 93.7%. Major pollution indicators that went beyond the standard value were sulfate, iron and TP. There were 329 groundwater drinking water source monitoring section (sites), 280 of which met water quality standard for the whole year, taking up 85.1% with major pollutants of manganese, iron and ammonia nitrogen exceeding standard value.
6. Key water conservancy projects
Three Gorges Project Area In 2017, among surface water monitoring indicators of main tributaries of Yangtze River in Three Gorges Project area, 7 indicators exceeded relevant quality standard. The percentage of the indices exceeding national quality standard for TP was 4.0%, COD 3.2%, ammonia nitrogen 1.5%, permanganate index 1.2%, BOD5 1.1%, anionic surfactant 0.1% and dissolved oxygen (DO) 0.2%. The comprehensive trophic state index of 77 monitoring sections was within the range of 23.1~79.6, among which 18.2% were at eutrophic status, 78.9% mesotrophic status and 2.9% oligotrophic status.
South-North Water Diversion Project (East Route) The Sanjiangying Section of the Jiajiang River, an intake of the East Route of South-North Water Diversion Project, met Grade III water quality standard. The Lunan Section of Beijing-Hangzhou Canal in the Middle Route met Grade IV standard. The Liyun Section, Baoying Section, Suqian Section, Hanzhuang Section and Liangji Section of Beijing-Hangzhou Canal in the Middle Route all met Grade III standard. Hongze Lake was of light eutrophication. Luoma Lake was at light eutrophication status, and Nansi Lake was at mesotrophic status, while Dongping Lake was of light eutrophication.
South-North Water Diversion Project (Central Route) Danjiangkou Reservoir was at mesotrophic status. Among the 17 water sections of 9 tributaries flowing into the Danjiangkou Reservoir, 1 section of the Hanjiang River met Grade I water quality standard; 5 sections met Grade II standard; 1 section of Danjiang River met Grade III standard, and 3 sections met Grade II standard. The inflow sections of the Tianhe River, Guanshan River and Langhe River met Grade III standard. 4 sections of Jinqian River, Duhe River, Laoguan River and Qihe River met Grade II standard. The intake of Taocha section met Grade III standard.
7. Provincial boundary waters
In 2017, the monitoring results of 544 important provincial boundary water sections across the country show that the percentage of sections meeting Grade I, Grade II, Grade III, Grade IV, Grade V and inferior to Grade V standard was 4.0%, 39.7%, 23.3%, 13.1%, 7.0% and 12.9% respectively. Major pollution indicators were COD, ammonia nitrogen and TP. The percentage of sections meeting Grade I∼III was almost the same as that of 2016 and 4.2 percentage points reduction was witnessed for sections failing to meet Grade V standard compared with that of 2016.
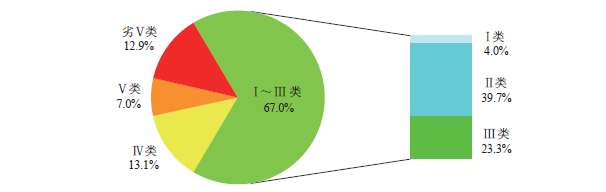
I~Ⅲ类:Grade Ⅰ~Ⅲ
劣V类:Inferior to Grade Ⅴ
V类:Grade V
IV类:Grade IV
I类:Grade I
II类:Grade II
III类:Grade III
8. Inland fisheries water
In 2017, National Fishery Ecological Environment Monitoring Network monitored 80 important spawning sites for fish and shrimp, feeding grounds, migration waterways, spawning zones and nature reserves of the Heilongjiang River basin, Yellow River basin, Yangtze River basin and Pearl River basin covering a total monitoring area of 1.873 million ha. Major pollution indicator of important river fisheries water was TN. Water areas with concentration of TN, permanganate index, TP, copper, petroleum, volatile phenol and nonionic ammonia superior to the assessment standard* accounted for 4.0%, 58.0%, 60.9%, 86.3%, 99.1%, 99.2% and 99.95% of the total monitoring areas respectively. The areas with indicators of permanganate index and copper exceeding standard increased at different degrees, while that of TN, TP, nonionic ammonia and volatile phenol decreased slightly compared with that of 2016. Major pollution indicators of important fisheries water of lakes and reservoirs were TN, TP and permanganate index. Water areas with concentration of TN, TP, permanganate index, petroleum, copper and volatile phenol superior to the assessment standard accounted for 8.8%, 14.6%, 34.8%, 86.3%, 91.9% and 98.2% of the total monitoring areas respectively. Compared with that of 2016, the areas with standard-exceeded indicators of permanganate index, petroleum and volatile phenol increased at different degrees, while that of TN, TP and copper decreased at different degrees. 41 national aquatic germplasm conservation areas (inland) were under national monitoring, covering a total monitoring area of 3.722 million ha. The major pollution indicator was TN. Water areas with concentration of TN, nonionic ammonia, permanganate index, petroleum, volatile phenol and TP superior to the assessment standard accounted for 0.9%, 80.1%, 93.9%, 94.4%, 96.1% and 98.2% of the total monitoring areas respectively.

Add: No.5 Houyingfang Hutong, Xicheng District, Beijing, P.R. ChinaPostal Code: 100035
Copyright © China-ASEAN Environmental Cooperation CenterRegistration Number/Site ID: ICP (BJ) No.05009132  Beijing Computer Information Network International Internet Unit 11010202009493